Leiden Ranking is special from the aspect, that it only works with factual data about publication performance, while other global rankings use normalized data (see more details: STABILITY AND DYNAMICS: SUMMARY OF GLOBAL RANKING INDICATORS 2021)
by Dóra Czirfusz
Therefore analysing Leiden’s results with other world rankings may give us an interesting slice of the world of higher education rankings, considering that information of Leiden list gives us a more objective picture about universities’ performance.
As the number of ranked institutes and the forms of published data vary in almost each ranking, we computed a derived score (similar to overall scores published for several rankings) for each institution for every ranking, showing what percentage of institutions performs better than a given university in the list.[1] This score allows us to compare performance among different rankings, and answer our main question: how other rankings relate to Leiden Ranking.
In the recent analysis only those universities are included, that meets the following criteria:
- Hungarian or foreign competitors of Hungarian universities (European institutes only)
- listed in each of the examined rankings in 2019/2020 (ARWU, Leiden, QS, THE, US New).
The sample consists the following 30 university:
| Austria | Croatia | Czech Republic | Finland | Hungary | Poland | Romania | Slovakia | Slovenia |
| Johannes Kepler University of Linz | University of Zagreb | Charles University | Aalto University | Budapest University of Technology and Economics | Adam Mickiewicz University | Babes-Bolyai University | Comenius University | University of Ljubljana |
| Technical University of Graz | Czech University of Life Sciences Prague | University of Helsinki | Eotvos Lorand University | Jagiellonian University | ||||
| University of Innsbruck | Czeh Technical University in Prague | University of Jyväskylä | University of Debrecen | Nicolaus Copernicus University | ||||
| University of Vienna | Masaryk University | University of Oulu | University of Szeged | University of Warsaw | ||||
| Vienna University of Technology | Palacky University | University of Tampere | Warsaw University of Technology |
An easy way to check whether institutions perform the same way in different rankings is to conduct a correlational analysis where we expect a strong positive correlation among each of the rankings.
The result is almost as expected, we can see significant positive connections among each rankings, but the degree of correlation varies. The two most similar rankings – according to the positions – are ARWU and THE, while the lowest correlation is between Leiden and QS. To answer our question about Leiden Ranking, we can take a look at Leiden’s column (in bold), where it can be seen that ARWU is the closest to Leiden’s ranking positions with a high positive correlation (r=0,763) then comes U.S. News (r=0,738), still considered as high correlation. THE (r=0,585) and QS (r=0,540) also have a significant relationship with Leiden, but to a moderate degree.
| Rankings | ARWU | Leiden | QS | THE | U.S. News |
| ARWU | – | ,763** | ,770** | ,840** | ,825** |
| Leiden | ,763** | – | ,540** | ,585** | ,738** |
| QS | ,770** | ,540** | – | ,805** | ,660** |
| THE | ,840** | ,585** | ,805** | – | ,770** |
| U.S. News | ,825** | ,738** | ,660** | ,770** | – |
| **. Correlation is significant at the 0.01 level (2-tailed). | |||||
The result is not surprising if we consider that in ARWU’s indicators scientific activity (publications and citations) is weighted by a total of 60%, where data comes from the Web of Science database, used by Leiden Ranking, as well. In contrast, QS uses Scopus database and gives only 20% to institutional research output.
The same tendency is visible if we take a look at the examined institution’s ranking positions: ARWU’s line deviates the least from Leiden’s positions, while QS shows the most differences.[2]
See our infographic: https://create.piktochart.com/output/42325622-hei-ranking
It is also visible that, except for THE rankings, Leiden’s published positions are mostly lower than the listed positions in ARWU, QS or US News. While 17 of the 30 institutions have higher positions in THE compared Leiden, QS ranked only one-third of the institutions higher than Leiden.
However, when comparing scores (which was the base for the correlation analysis, too), it can be seen that ARWU gives higher scores to each of the institutions in our sample, and QS scored higher than Leiden only one from the 30 institutions. Furthermore, it turns out that scores higher than Leiden appear in most institutions for all of the rankings examined.
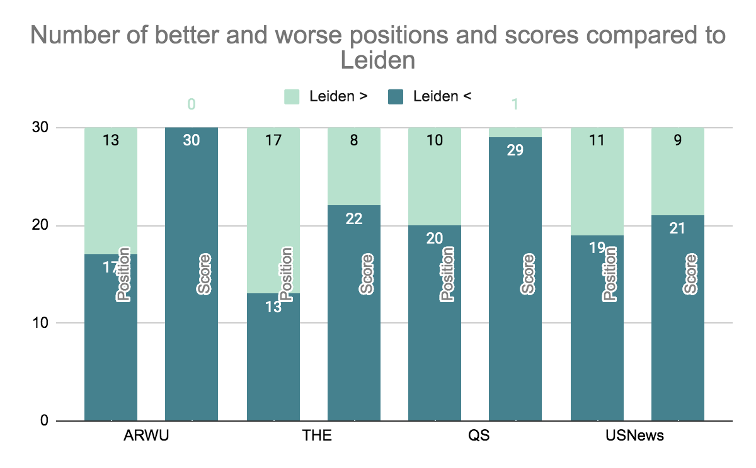
In conclusion, we can say that ARWU provides the closest performance to Leiden, according to the derived scores, while QS has the lowest correlation with Leiden. Positions and scores show different aspects of the analysis: when examining positions, THE rated most of the institutions better (17 from the 30) than Leiden, but when we consider the number of listed institutions in each ranking and we calculate using the scores, it comes out that Leiden’s scores are mostly lower than scores in any of the examined rankings. According to this analysis it seems that multi criteria indicators can help these institutions perform better than in Leiden Ranking, where only publication performance is considered.
[1] For those positions where an interval was published we used the average (e.g. 601-700 is 650,5), then the following formula was calculated: score=position/number of ranked institution*100.
[2] This chart shows the actual positions, not the derived scores.
 Dr. habil György Fábri (1964) is an habilitated associate professor (Institute of research on Adult Education and Knowledge Management, Faculty of Education and Psychology of Eötvös Loránd University), head of the Social Communication Research Group. Areas of research: university philosophy, sociology of higher education and science, science communication, social communication, church sociology. His monograph was published on the transformation of Hungarian higher education during the change of regime (1992 Wien) and on university rankings (2017 Budapest). He has edited several scientific journals, and his university courses and publications cover communication theory, university philosophy, science communication, social representation, media and social philosophy, ethics, and church sociology.
 Mr. Degli Esposti is Full Professor at the Department of Computer Science and Engineering, Deputy Rector Alma Mater Studiorum Università di Bologna, Dean of Biblioteca Universitaria di Bologna, Head of Service for the health and safety of people in the workplace, President of the Alma Mater Foundation and Delegate for Rankings.
 Ben joined QS in 2002 and has led institutional performance insights function of QS since its emergence following the early success of the QS World University Rankings®. His team is, today, responsible for the operational management of all major QS research projects including the QS World University Rankings® and variants by region and subject. Comprising over 60 people in five international locations, the team also operate a widely adopted university rating system – QS Stars – and a range of commissioned business intelligence and strategic advisory services.Ben has travelled to over 50 countries and spoken on his research in almost 40. He has personally visited over 50 of the world’s top 100 universities amongst countless others and is a regular and sought after speaker on the conference circuit.Ben is married and has two sons; if he had any free time it would be spent reading, watching movies and skiing.
 Anna Urbanovics is a PhD student at Doctoral School of Public Administration Sciences of the University of Public Service, and studies Sociology Master of Arts at the Corvinus University of Budapest. She is graduated in International Security Studies Master of Arts at the University of Public Service. She does research in Scientometrics and International Relations.

 Dr. Mircea Dumitru is a Professor of Philosophy at the University of Bucharest (since 2004). Rector of the University of Bucharest (since 2011). President of the European Society of Analytic Philosophy (2011 – 2014). Corresponding Fellow of the Romanian Academy (since 2014). Minister of Education and Scientific Research (July 2016 – January 2017). Visiting Professor at Beijing Normal University (2017 – 2022). President of the International Institute of Philosophy (2017 – 2020). President of Balkan Universities Association (2019 – 2020). He holds a PhD in Philosophy at Tulane University, New Orleans, USA (1998) with a topic in modal logic and philosophy of mathematics, and another PhD in Philosophy at the University of Bucharest (1998) with a topic in philosophy of language. Invited Professor at Tulsa University (USA), CUNY (USA), NYU (USA), Lyon 3, ENS Lyon, University of Helsinki, CUPL (Beijing, China), Pekin University (Beijing, China). Main area of research: philosophical logic, metaphysics, and philosophy of language. Main publications: Modality and Incompleteness (UMI, Ann Arbor, 1998); Modalitate si incompletitudine, (Paideia Publishing House, 2001, in Romanian; the book received the Mircea Florian Prize of the Romanian Academy); Logic and Philosophical Explorations (Humanitas, Bucharest, 2004, in Romanian); Words, Theories, and Things. Quine in Focus (ed.) (Pelican, 2009); Truth (ed.) (Bucharest University Publishing House, 2013); article on the Philosophy of Kit Fine, in The Cambridge Dictionary of Philosophy, the Third Edition, Robert Audi (ed.) (Cambridge University Press, 2015), Metaphysics, Meaning, and Modality. Themes from Kit Fine (ed.) (Oxford University Press, forthcoming).
 Since 1 February 2019 Minister Palkovics as Government Commissioner has been responsible for the coordination of the tasks prescribed in Act XXIV of 2016 on the promulgation of the Agreement between the Government of Hungary and the Government of the People’s Republic of China on the development, implementation and financing of the Hungarian section of the Budapest-Belgrade Railway Reconstruction Project.

 He is the past President of the Health and Health Care Economics Section of the Hungarian Economics Association.

 Based in Berlin, Zuzanna Gorenstein is Head of Project of the German Rectors’ Conference (HRK) service project “International University Rankings” since 2019. Her work at HRK encompasses the conceptual development and implementation of targeted advisory, networking, and communication measures for German universities’ ranking officers. Before joining the HRK, Zuzanna Gorenstein herself served as ranking officer of Freie Universität Berlin.
 His books on mathematical modeling of chemical, biological, and other complex systems have been published by Princeton University Press, MIT Press, Springer Publishing house. His new book RANKING: The Unwritten Rules of the Social Game We All Play was published recently by the Oxford University Press, and is already under translation for several languages.