Six indicators are used to establish the ARWU overall ranking (“Shanghai-ranking”), the instructor’s scientific activity (publications and awards) is weighted by a total of 80%, and the quality of education and individual scientific performance are included by 10 percent each. In contrast, only five indicators are considered in the ranking of subjects, with different weights by subjects.[1] Publication activity is measured on the basis of the Web of Science database (this is also used by Leiden ranking), citations are calculated from the InCites database, just as the indicator of international collaboration. The following indicator also measures publication performance, which is calculated on the basis of studies published in the authors’ best-rated journals (listed here), and finally uses the indicator of scientific awards given by lecturers, which is based on different scientific awards. Each institution is given a percentage of the best score based on normalized data for every indicator. When calculating the overall score, the square root of the scores for each indicator is multiplied by the weight of the particular indicator.
In Times Higher Education World University Rankings positions were calculated by the indicators used in previous years, so the learning environment, research and publication performance all shaped the ranking with a 30-30% weight, while international outlook gets 7,5% and industry income has a 2,5% weight. The overall score is calculated by a z-score (except for the results of Academic Reputation Survey), which standardizes the values measured on different scales, allowing comparison. The score is based on the distance taken from the average of the entire database, indicating how many standard deviations each measured value falls from the average. The z-scores are then converted to a cumulative probability score, which gives the final score, which shows how likely another institution is to perform under that institution.[2]
THE New Europe ranked 53 European institutions in 2018 using the same methodology as the THE World Rankings (in which 1400 institutions were ranked in 2018), but this ranking was not completed in 2019. In THE Emerging Economics ranking developing countries are included (classified by the London Stock Exchange’s FTSE Group as “advanced emerging”, “secondary emerging” or “frontier”), using THE World University Ranking indicators, while assigning different weights to each indicator. In this ranking, both learning environment and research account for 30% of the ranking, while publication is only 20% (compared to 30% in THE global ranking). International outlook and the industry income both weighs 10-10 % (compared to 7.5% and 2.5%). In 2019 533 institutes were included in this ranking.
QS World University Rankings takes academic reputation into account with a weight of 40%, and the faculty/student ratio is 20%, just as citations per faculty – which is calculated based on the Scopus database. The employer reputation weighs 10%, while the international faculty ratio and international student ratio are both worth 5% of the overall total. Since 2014, QS has been compiling a special regional rankings by examining the countries of Eastern Europe and Central Asia (QS EECA). To this end, they modified the system of indicators used in their global rankings: the result of their academic reputation survey is worth only 30% in EECA rankings, but the employer reputation weighs 20% instead of 10%. The proportion of international lecturers and students weights 2,5% each. QS Subject Ranking is also prepared with different weightings, which is described in detail on their website. Overall score is published on a transformed scale from 0 to 100, which is also calculated based on the z-score.[3]
US News has been making rankings since 2014, and in addition to global comparisons, they are also making rankings by subjects. The ranking, published in October 2019, listed 1599 institutions from a total of 81 countries. Based on the methodology, the excellence of each institution is measured in 13 indicators. Indicators measuring publication and citation are given a total weighting of 65%, reputation is added by 25%, and international cooperation is worth 10%. For 9 of the 13 indicators, a logarithmic transformation was performed for normalization, and then the values were compared using z-scores.[4] Overall score was calculated after multiplying each indicator score by the appropriate weight, and then subtracting the lowest total score from each score, 0 became the lowest total score. Each total score was then divided by the score of the best performing university and multiplied by 100 to obtain a scale from 0 to 100, which is published alongside the ranking of each university.
The Leiden ranking works with public data based on the Web of Science database as opposed to the rankings mentioned earlier. Leiden ranking measures scientific impact and collaboration. Data used in the calculation includes the number of publications registered by the Web of Science database per institution. Within these two indicators the most cited publications (1%, 5% and 10%) can be seen in absolute value and in proportion, as well. The number and proportion of co-authored works are also shown, including cooperation between countries, cooperation with industrial organizations, and regional and international cooperation.
A distinction between rankings based on purely factual data (Leiden) and rankings using normalization (ARWU, THE, QS, US News) need to be done. The big advantage of the former is that it works with absolute values, so an easily comparable ranking suitable for time series analysis is created, where the reasons behind the advancement or backwardness of each institution become apparent from the data. Its disadvantage, however, is that it measures the excellence of an institution solely in terms of publication performance, ignoring a number of other aspects that may be suitable for measuring scientific performance.
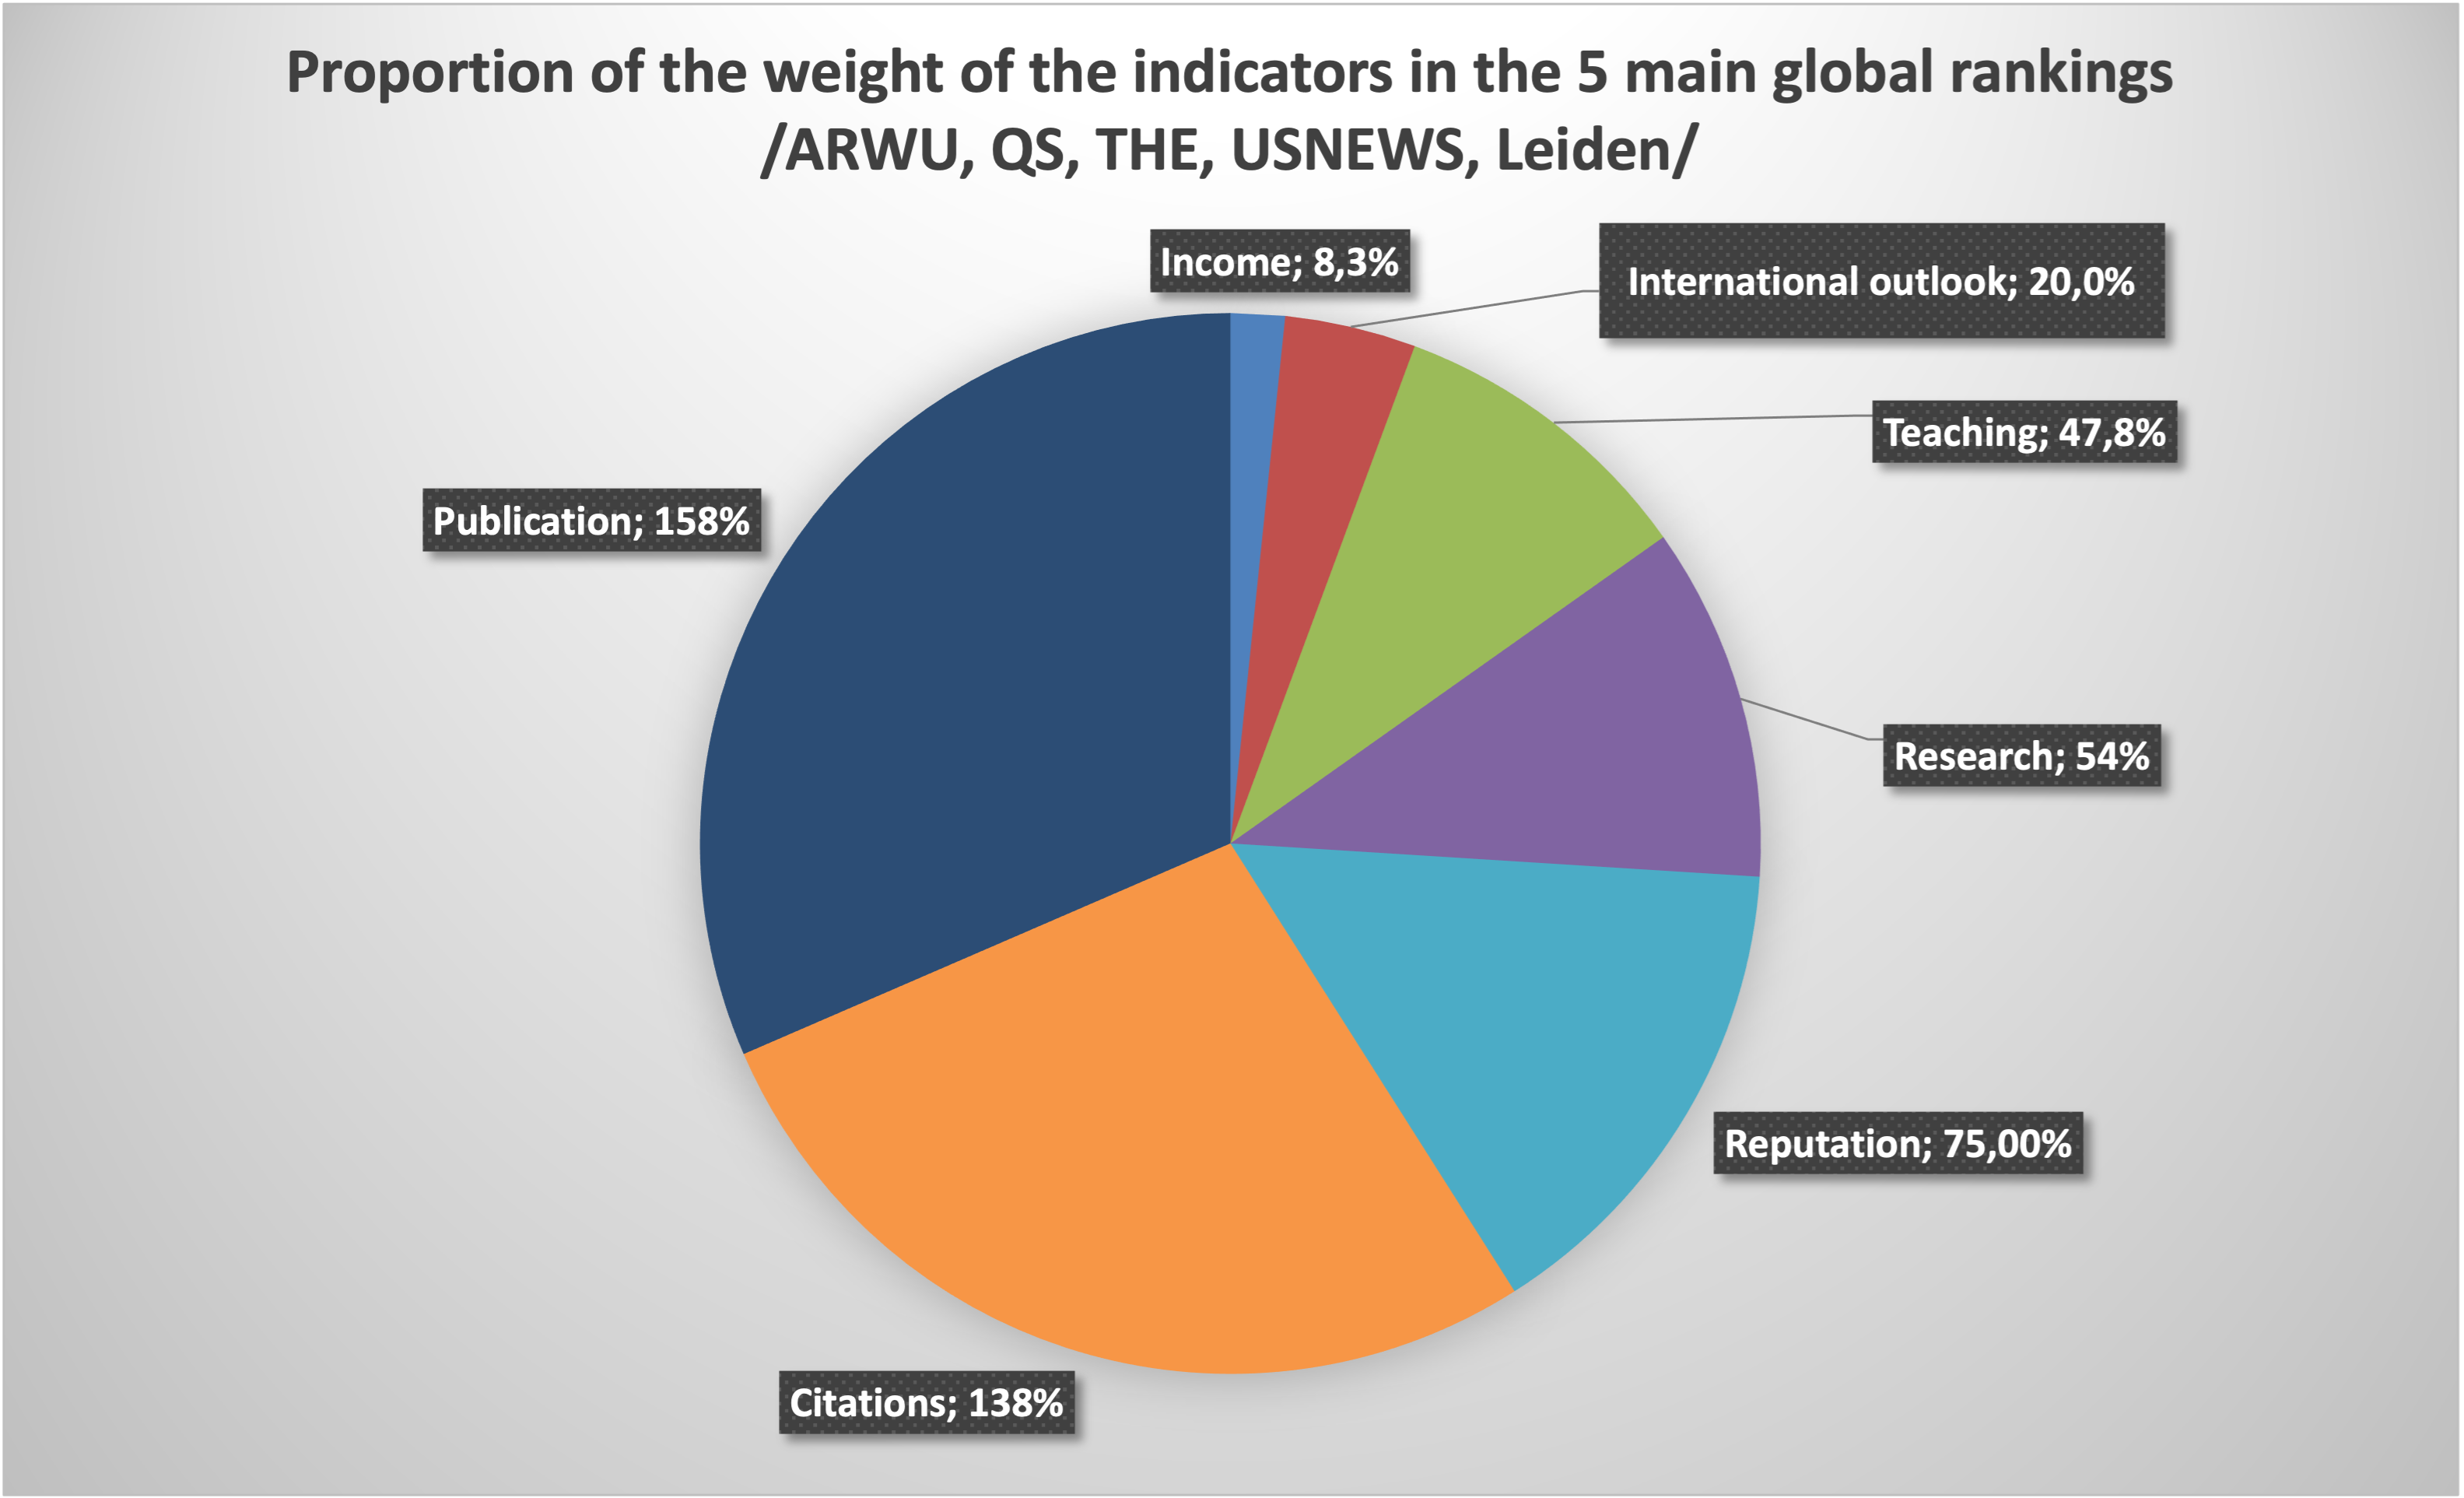
The disadvantage of multi-criteria rankings working with normalized data is the difficulty of comparison. The performance of the institutions will be relative to themselves, as the z-score is always calculated from the average of total data in the given year, which therefore depends on the institutions currently entering, plus the current performance of each institution. Without knowing the factual data, it is difficult to examine the nature of the improvement or decline, as the performance of one institution is presented in relation to other institutions in the ranking, so the result of the institutions measured in each indicator is relative. In addition, for the purpose of multi-criteria analysis, each ranking works with different indicators, where not only the definition of each indicator, but also the data sources used for their measurement may be of a different nature. This is well illustrated, for example, by the differences between the databases used to measure publications: ARWU uses the Web of Science database, QS has used the Scopus database since 2007. In addition, the measurement of a publication can be varied, too: citations, number of publications in qualified journals, number or proportion of co-authored studies, and we could further list the various indicators used in the rankings. Further differences can be seen in the number of indicators (e.g. QS uses 6 indicators versus US News with 13 indicators) as well as in the weightings. Due to the diversity in the making of the rankings, one’s position will always depend on the methodology behind that ranking. However, a comparison of the individual rankings shows that the best universities will be among the best in all rankings, and Hungarian institutions will perform almost the same way in each ranking (usually in the middle).
[1] More details at Shanghai Ranking
[2] For example, the score of ELTE in 2019 was 29.6, so the chance of a random institution to be listed below ELTE is 29.6%.
[3] Similar to THE Ranking, z-score is based on the distance taken from the average of the entire database, giving how many standard deviations each measured value falls from the average.
[4] It is also necessary to take into account that for some indicators a lower value, while for other indicators a higher value means better performance, which is described in detail on the website.
 Dr. habil György Fábri (1964) is an habilitated associate professor (Institute of research on Adult Education and Knowledge Management, Faculty of Education and Psychology of Eötvös Loránd University), head of the Social Communication Research Group. Areas of research: university philosophy, sociology of higher education and science, science communication, social communication, church sociology. His monograph was published on the transformation of Hungarian higher education during the change of regime (1992 Wien) and on university rankings (2017 Budapest). He has edited several scientific journals, and his university courses and publications cover communication theory, university philosophy, science communication, social representation, media and social philosophy, ethics, and church sociology.
 Mr. Degli Esposti is Full Professor at the Department of Computer Science and Engineering, Deputy Rector Alma Mater Studiorum Università di Bologna, Dean of Biblioteca Universitaria di Bologna, Head of Service for the health and safety of people in the workplace, President of the Alma Mater Foundation and Delegate for Rankings.
 Ben joined QS in 2002 and has led institutional performance insights function of QS since its emergence following the early success of the QS World University Rankings®. His team is, today, responsible for the operational management of all major QS research projects including the QS World University Rankings® and variants by region and subject. Comprising over 60 people in five international locations, the team also operate a widely adopted university rating system – QS Stars – and a range of commissioned business intelligence and strategic advisory services.Ben has travelled to over 50 countries and spoken on his research in almost 40. He has personally visited over 50 of the world’s top 100 universities amongst countless others and is a regular and sought after speaker on the conference circuit.Ben is married and has two sons; if he had any free time it would be spent reading, watching movies and skiing.
 Anna Urbanovics is a PhD student at Doctoral School of Public Administration Sciences of the University of Public Service, and studies Sociology Master of Arts at the Corvinus University of Budapest. She is graduated in International Security Studies Master of Arts at the University of Public Service. She does research in Scientometrics and International Relations.

 Dr. Mircea Dumitru is a Professor of Philosophy at the University of Bucharest (since 2004). Rector of the University of Bucharest (since 2011). President of the European Society of Analytic Philosophy (2011 – 2014). Corresponding Fellow of the Romanian Academy (since 2014). Minister of Education and Scientific Research (July 2016 – January 2017). Visiting Professor at Beijing Normal University (2017 – 2022). President of the International Institute of Philosophy (2017 – 2020). President of Balkan Universities Association (2019 – 2020). He holds a PhD in Philosophy at Tulane University, New Orleans, USA (1998) with a topic in modal logic and philosophy of mathematics, and another PhD in Philosophy at the University of Bucharest (1998) with a topic in philosophy of language. Invited Professor at Tulsa University (USA), CUNY (USA), NYU (USA), Lyon 3, ENS Lyon, University of Helsinki, CUPL (Beijing, China), Pekin University (Beijing, China). Main area of research: philosophical logic, metaphysics, and philosophy of language. Main publications: Modality and Incompleteness (UMI, Ann Arbor, 1998); Modalitate si incompletitudine, (Paideia Publishing House, 2001, in Romanian; the book received the Mircea Florian Prize of the Romanian Academy); Logic and Philosophical Explorations (Humanitas, Bucharest, 2004, in Romanian); Words, Theories, and Things. Quine in Focus (ed.) (Pelican, 2009); Truth (ed.) (Bucharest University Publishing House, 2013); article on the Philosophy of Kit Fine, in The Cambridge Dictionary of Philosophy, the Third Edition, Robert Audi (ed.) (Cambridge University Press, 2015), Metaphysics, Meaning, and Modality. Themes from Kit Fine (ed.) (Oxford University Press, forthcoming).
 Since 1 February 2019 Minister Palkovics as Government Commissioner has been responsible for the coordination of the tasks prescribed in Act XXIV of 2016 on the promulgation of the Agreement between the Government of Hungary and the Government of the People’s Republic of China on the development, implementation and financing of the Hungarian section of the Budapest-Belgrade Railway Reconstruction Project.
 He is the past President of the Health and Health Care Economics Section of the Hungarian Economics Association.

 Based in Berlin, Zuzanna Gorenstein is Head of Project of the German Rectors’ Conference (HRK) service project “International University Rankings” since 2019. Her work at HRK encompasses the conceptual development and implementation of targeted advisory, networking, and communication measures for German universities’ ranking officers. Before joining the HRK, Zuzanna Gorenstein herself served as ranking officer of Freie Universität Berlin.
 His books on mathematical modeling of chemical, biological, and other complex systems have been published by Princeton University Press, MIT Press, Springer Publishing house. His new book RANKING: The Unwritten Rules of the Social Game We All Play was published recently by the Oxford University Press, and is already under translation for several languages.